Lab to living room: How to benchmark your cycling fitness at home
Physiological testing is no longer the preserve of the sports science lab. Hill-climb champion and coach Tom Bell explains how to measure your key benchmarks from the (dis)comfort of your home
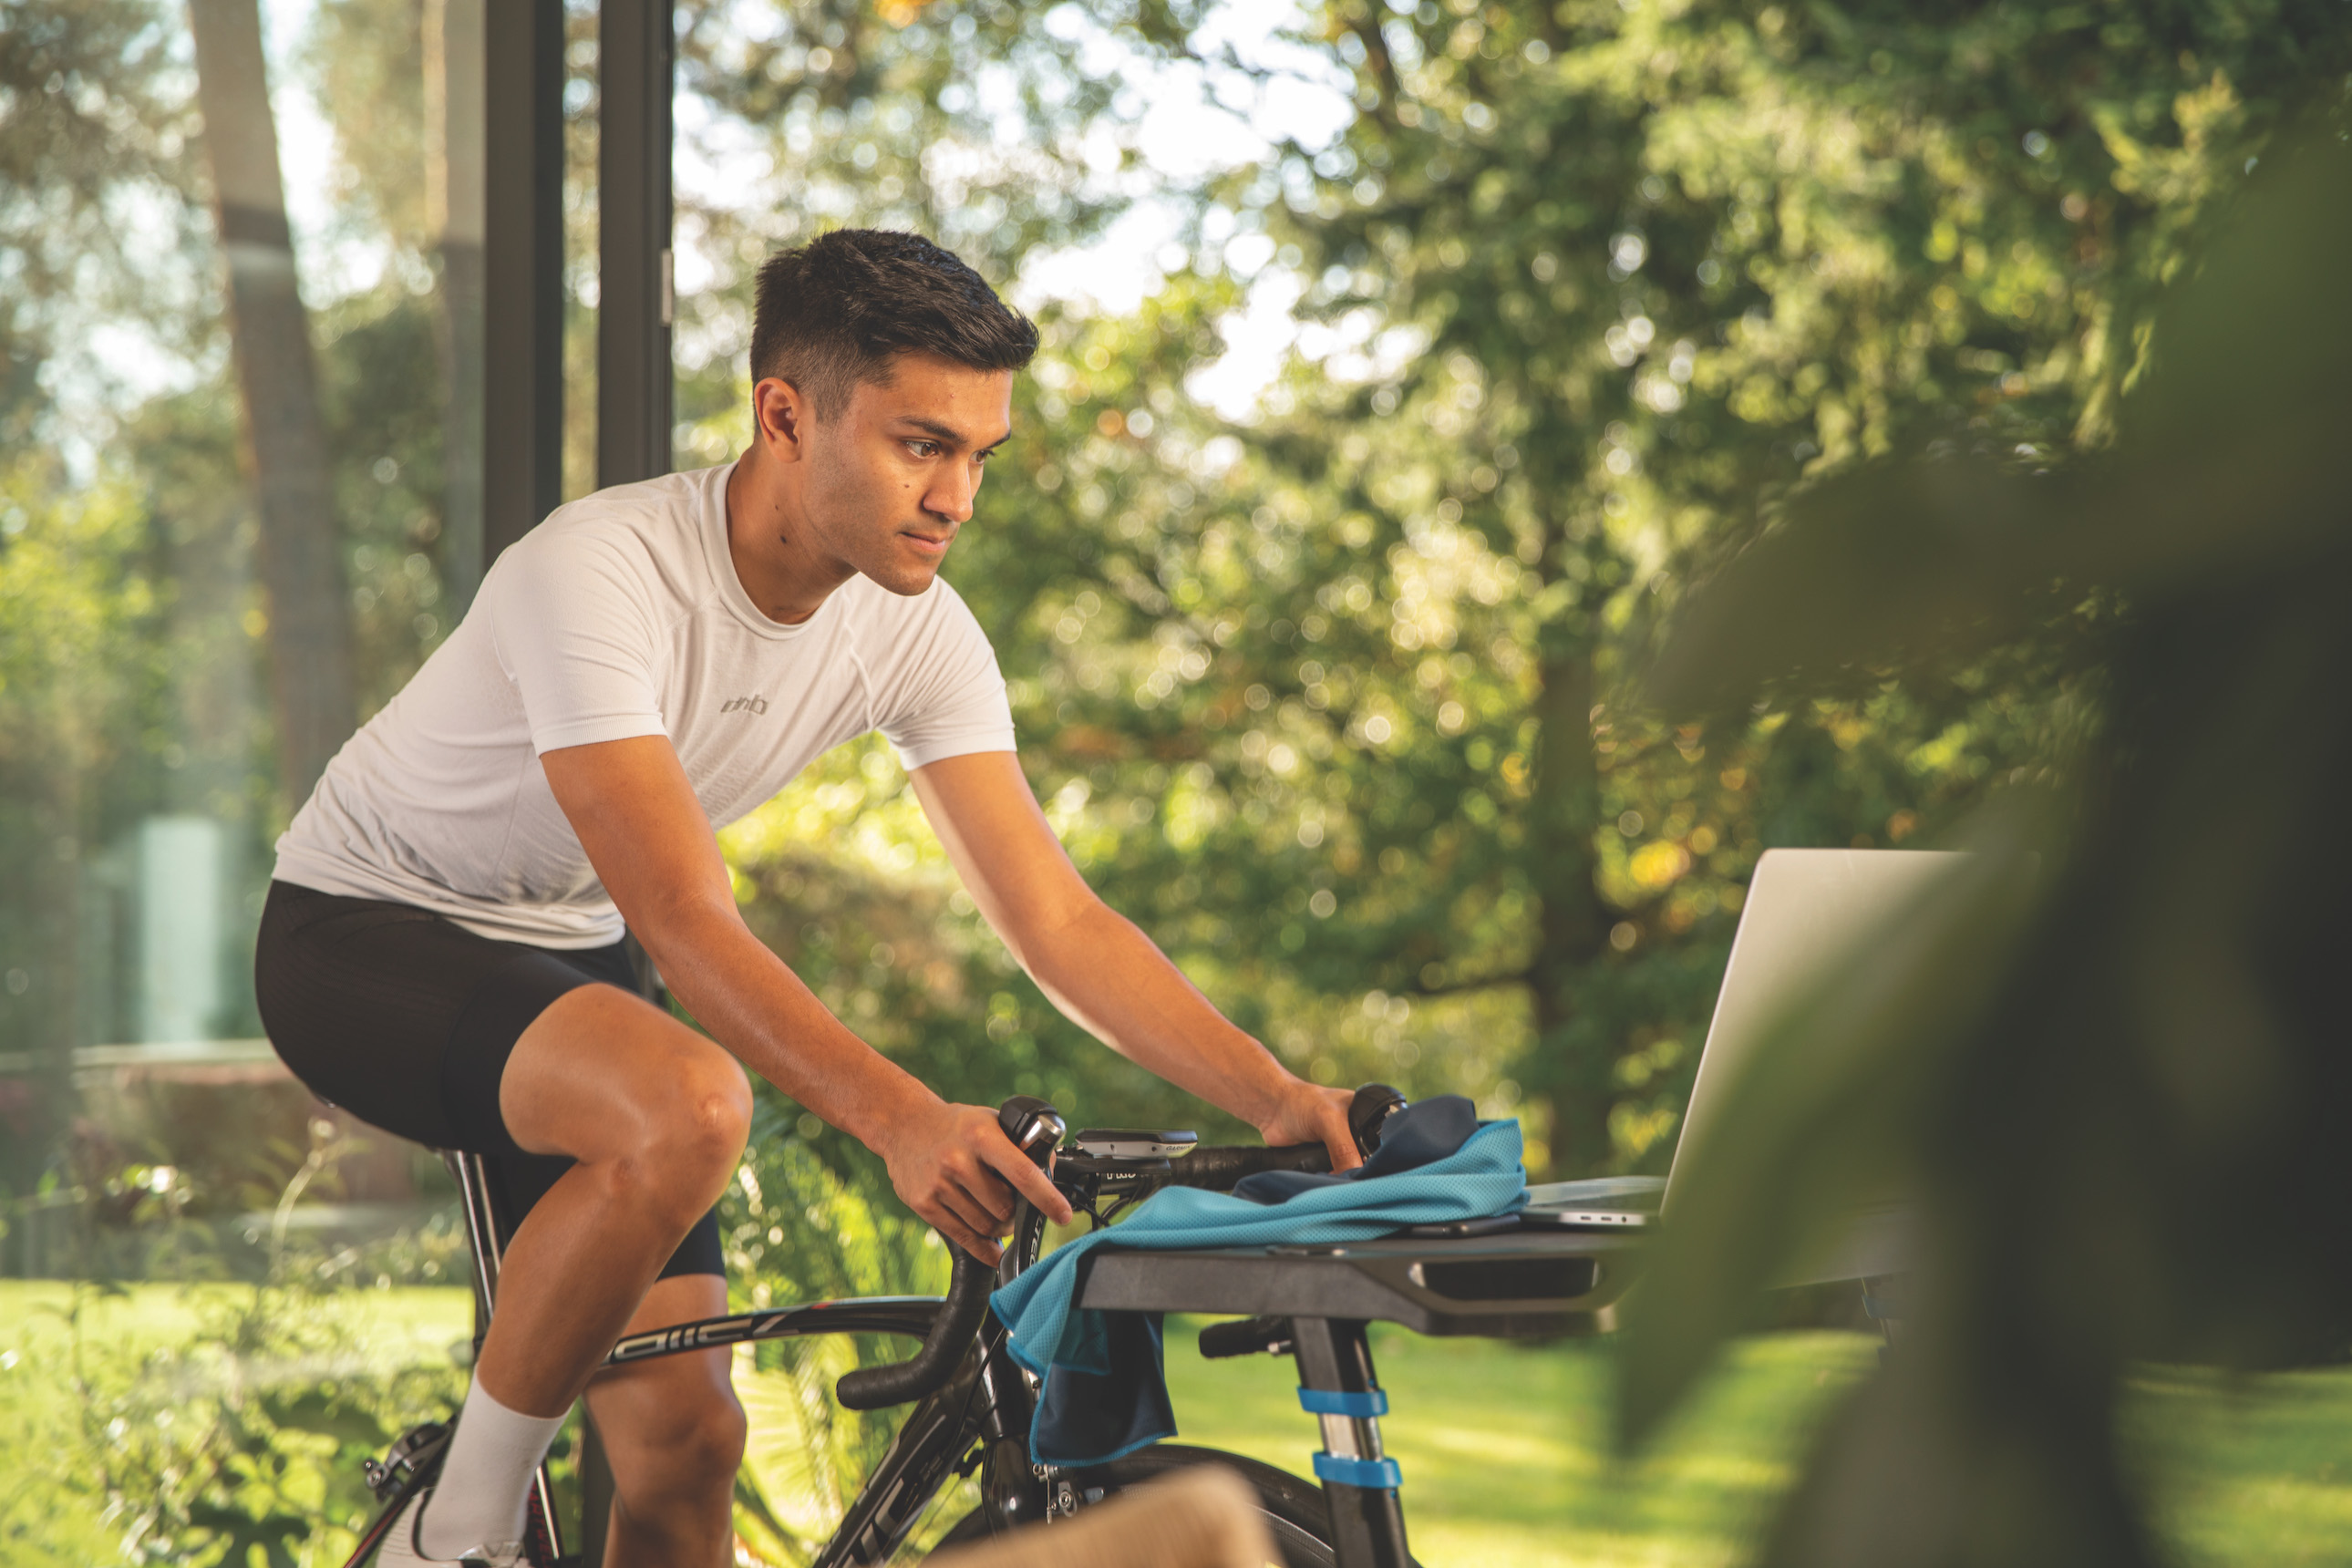
Over the last few weeks, many pro racers and their coaches have been busy testing in the lab. This early-season testing is a mainstay at the top level of the sport. It helps coaches understand their athletes’ fitness profiles and to set training intensity targets and priorities. But fitness testing isn’t just for pros. It can be helpful for cyclists of all abilities – and in this feature we will explore the home-based testing protocols that you can undertake for a fraction of the cost of lab testing.
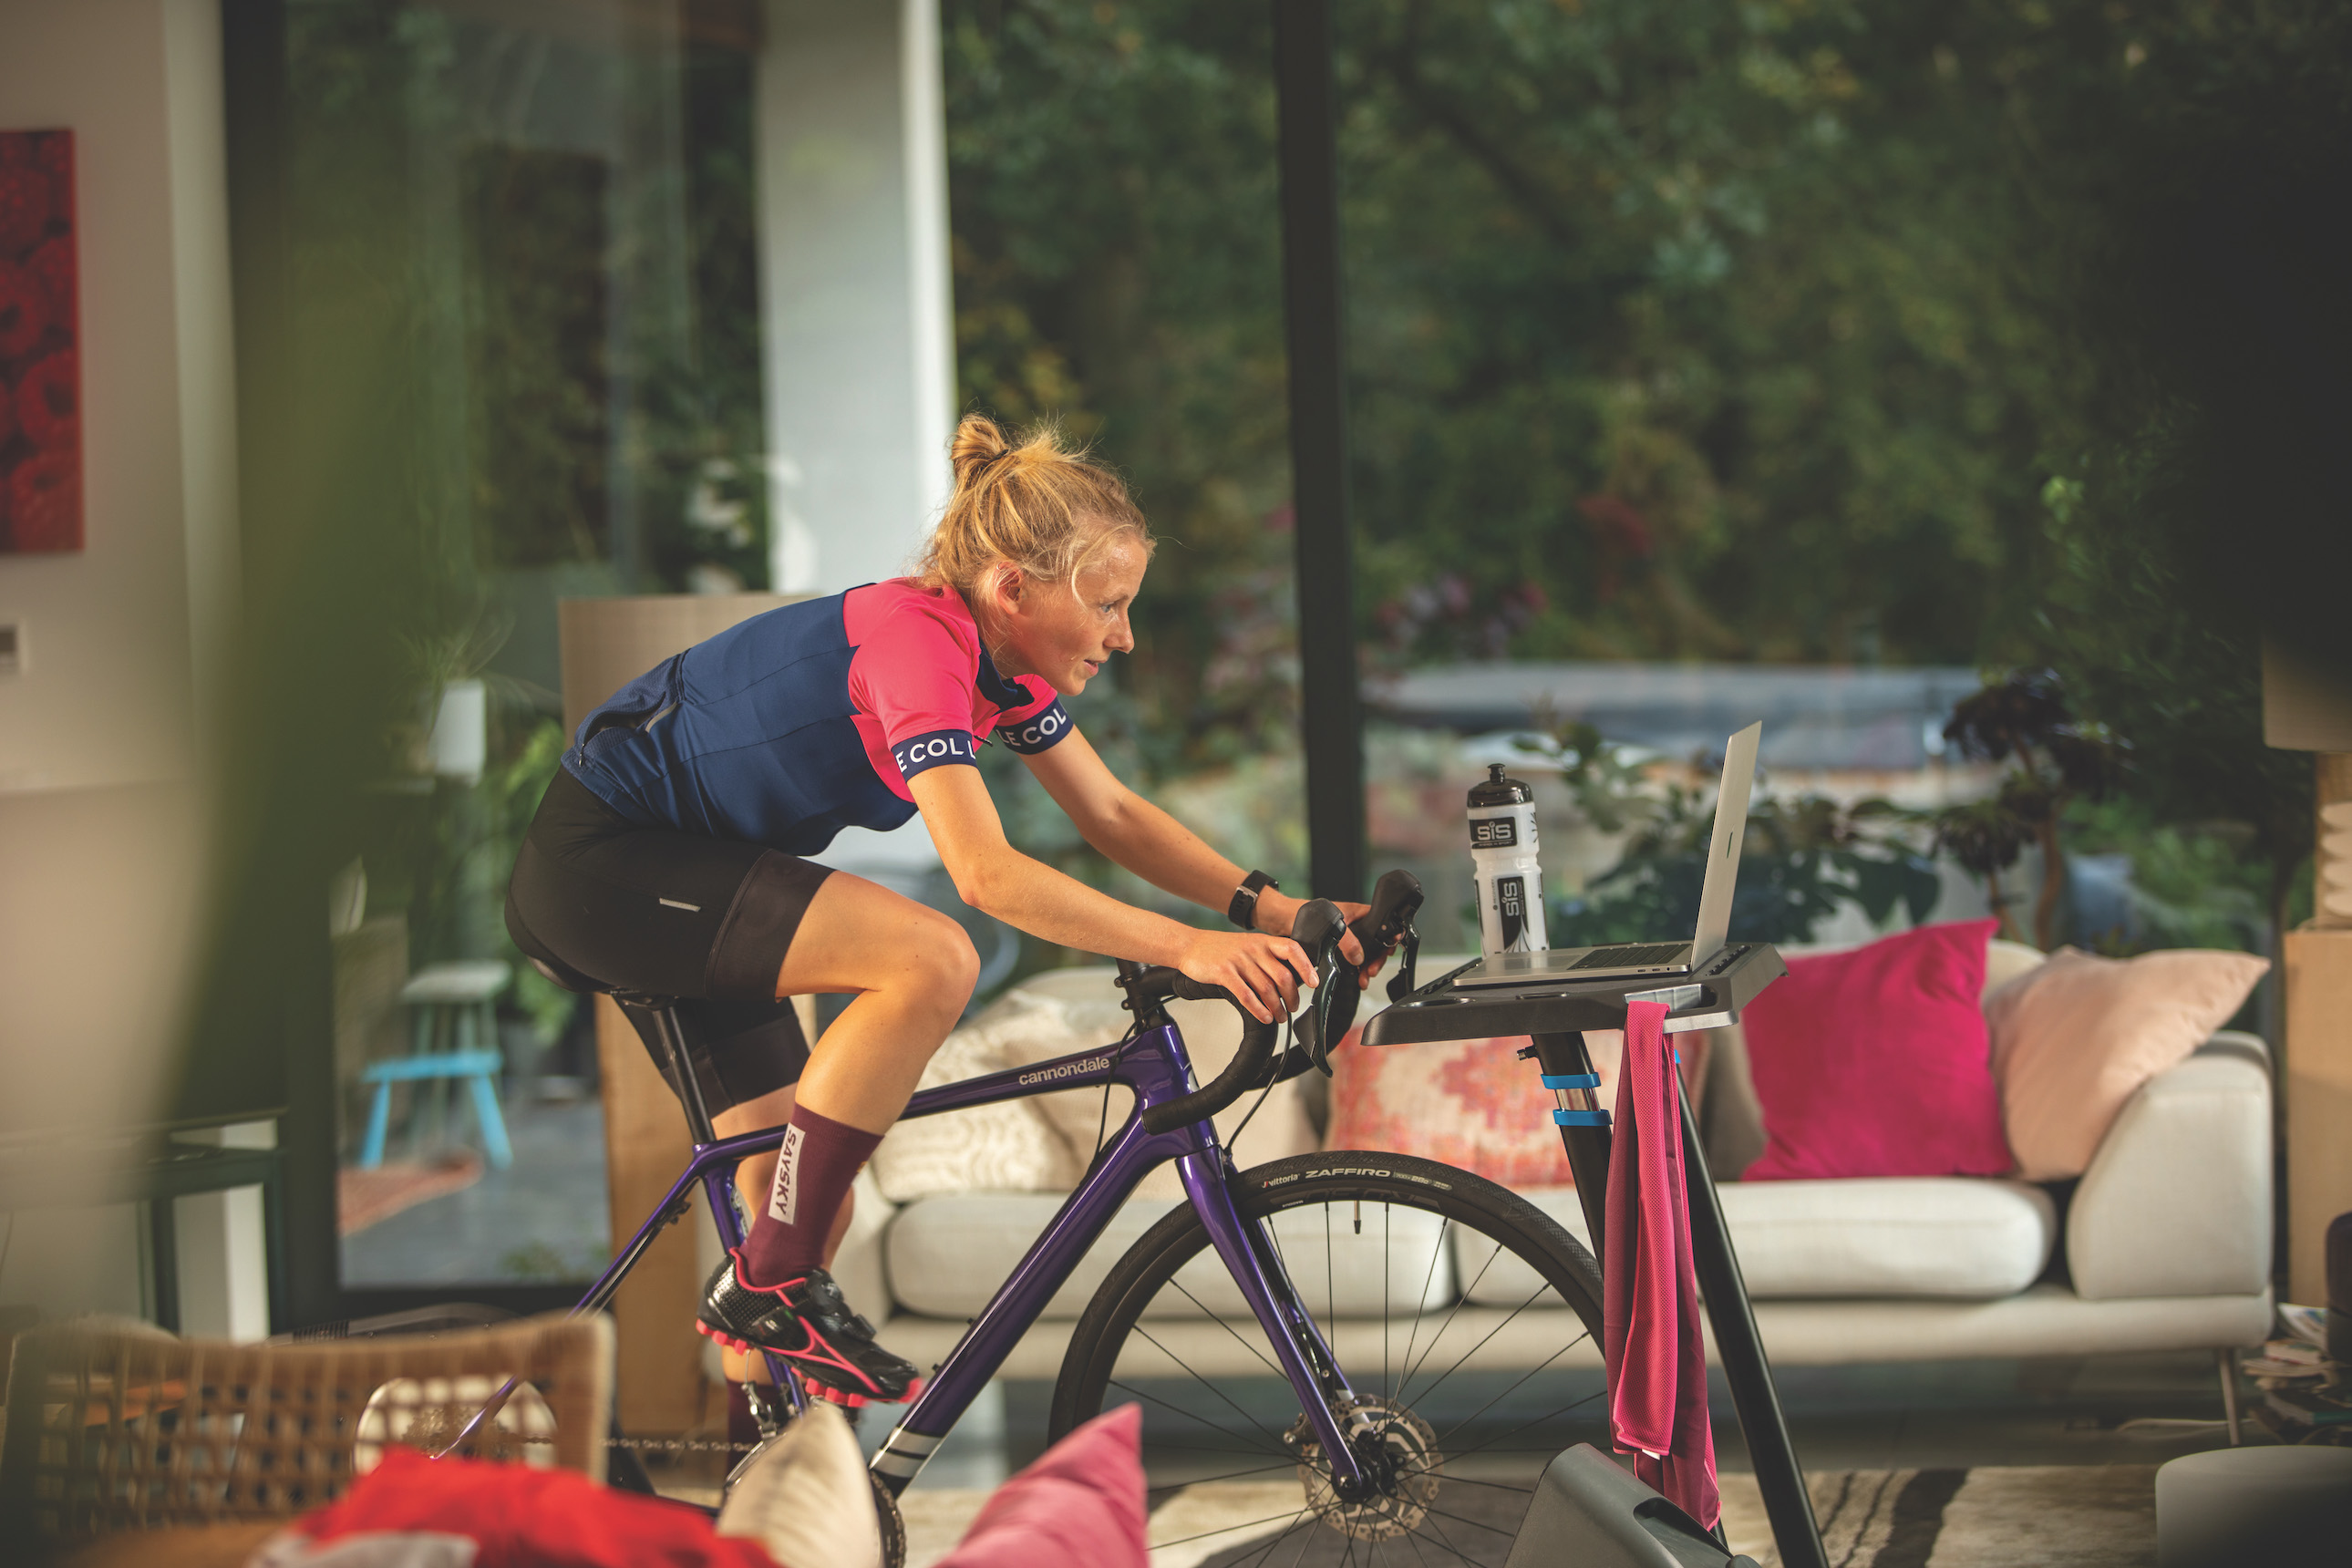
As a coach, I often have athletes use home-based testing because it can be performed more regularly, and also provides important data on actual performance as opposed to physiological metrics such as VO2 max, which don’t always predict real-world performance. In this feature, we’ll review three homebased testing approaches that require only a power meter or smart trainer and a device, such as a laptop or cycling computer, to record the data.
We’ll follow two hypothetical athletes through this article to explore how well the different testing protocols work for different individuals, assessing the pros and cons of the different methods. Both datasets are from real athletes, albeit with names changed for confidentiality.
Our first athlete, Jane, describes herself as a “diesel engine”. She is able to maintain high power in steadier events (4.4W/kg for over an hour), but struggles to respond to breakaways. Our second athlete, Sarah, is a more explosive rider and excels in races with many surges and attacks. She has a slightly lower one-hour power of 4.3W/kg. Both are preparing for punchy criterium-style races.
The 20-minute FTP test
This protocol (see box) is intended to estimate Functional Threshold Power (FTP), which is the maximum sustainable power over 40-60 minutes. This closely corresponds to the maximum lactate steady state (MLSS), which is a key marker of endurance cycling fitness often tested in the lab.
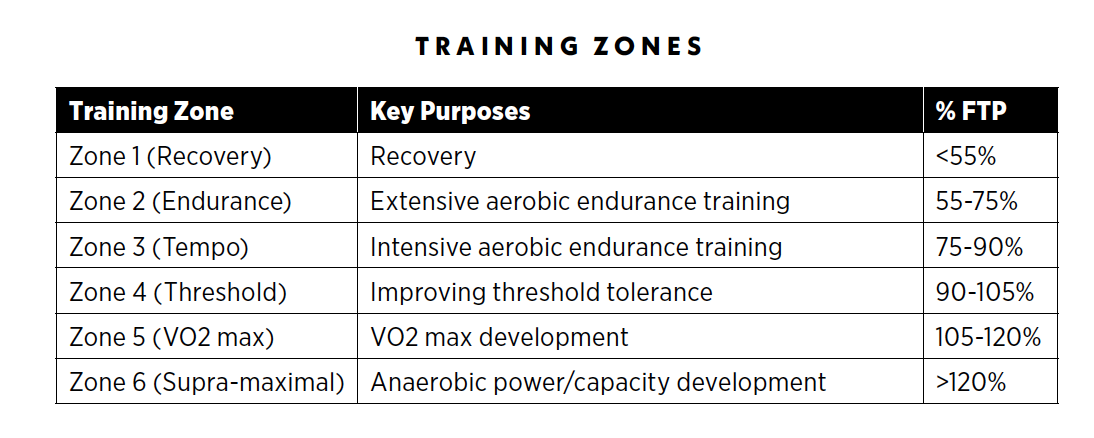
A key benefit of this protocol is its simplicity. It’s easy to estimate FTP and see how this has changed in response to training. Training intensity zones can also be calculated based on percentages of FTP, such Dr Andrew Coggan’s intensity zones (see box).
A limitation of this test is that it only assesses one aspect of your fitness profile. Looking at the data from Jane and Sarah, below, we can say for sure that Sarah seems to have a slightly higher FTP. However, the testing doesn’t tell us anything about how these athletes perform over shorter efforts, or what their endurance abilities might be like over several hours. On the basis of the FTP test alone, we can’t confidently say, for either athlete, what they should focus on in training.
Get The Leadout Newsletter
The latest race content, interviews, features, reviews and expert buying guides, direct to your inbox!
Another limitation is that the FTP estimate is influenced by a rider’s capacity to ride above their FTP, sometimes referred to as anaerobic capacity. For athletes with an abnormally large anaerobic capacity, the 20-minute test tends to produce inflated FTP estimates, while under-estimating FTP for those with a smaller anaerobic capacity. We can see this in Sarah’s data. We know her one-hour power is about 4.3W/kg, but her FTP estimate is notably higher at 4.8W/kg.
We’d recommend using a testing protocol that includes a pre-fatiguing effort before the main 20-minute test. This helps to reduce the influence of anaerobic capacity on the FTP result. A final limitation of the 20-minute test is that it’s mentally and physically tough to perform, especially with the inclusion of a pre-fatiguing effort. It requires good pacing during the test, which can be hard if you’re not sure what power to aim for or are relatively new to cycling.
All in all, the FTP test is useful for those who want to get some basic information on where their current fitness lies and set some general training targets. It is of limited value for novice cyclists, and isn’t good enough (by itself) for understanding strengths and limiters.
Why do it?
Assess changes in FTP over time
Set cycling training zones
The protocol
There are a number of slightly different protocols. The best include some bouts of intensity prior to the main 20-minute test to induce prior fatigue, and thereby reduce the influence of anaerobic capacity on the FTP estimate.
Warm-Up
20min warm-up @ Z1; 5min time trial paced as a consistent but maximal effort; 10min @ Z1
Test
20min effort paced as evenly as possible The first one-third should feel manageable, the middle should start to feel tough, and the last few minutes should feel like a max effort.
Analysis
FTP is calculated as 95% of the 20-minute average power
How our athletes scored
Jane:
Average 20min power: 252W
Estimated FTP: 239W (4.6W/kg)
Sarah:
Average 20min power: 270W
Estimated FTP: 257W (4.8W/kg)
The ramp test
This protocol (below) is an alternative to the 20-minute test. The results can also be used to determine Maximal Aerobic Power (MAP), the maximum power you reach at the end of the test, which correlates with VO2 max. Training intensity zones can be set based on your estimated FTP in the same way as for the 20-minute FTP test.
Unlike the 20-minute test, the ramp test is performed in erg mode on a smart trainer, so the results aren’t reliant on pacing. This means it’s more suited to novice riders. The test is also shorter than the 20-minute test, and for most athletes only begins to feel hard in the final few minutes. It’s therefore less daunting than the 20-minute test.
The ramp test is simple, and most training platforms automatically calculate an FTP estimate for you once completed. A limitation of this test, though, is that it does not accurately replicate a real-life sustained effort (i.e. a 40-60 minute time trial). The FTP estimate may therefore be less accurate than that produced by the 20-minute test, especially for people with a particularly high or low anaerobic capacity.
We can see this from Jane and Sarah’s data. Jane’s estimated FTP has come out slightly lower than that predicted by her 20-minute test (4.5W/kg vs 4.6W.kg), whereas Sarah’s has come out slightly higher (4.9W/kg vs 4.8W/kg). In my experience, the ramp test often overestimates FTP in amateur and time-crunched cyclists who generally have a stronger anaerobic capacity relative to their aerobic engine.
As with the 20-minute test, the ramp test provides only a snapshot of an athlete’s fitness profile. The key differences between Jane and Sarah – i.e. that one is a punchy rider, the other a ‘diesel engine’ – are not revealed by this test.
Overall, the ramp test is useful for those who struggle with pacing or want to assess their MAP. However, the 20-minute protocol is more accurate for estimating FTP and setting FTP-based training zones. The ramp test is not helpful (by itself) in assessing strengths and limiters.
Why do it?
Assess changes in maximal aerobic power (MAP).
Estimate FTP and set training zones for people who struggle with pacing using other testing protocols.
The protocol
Power is increased in steps, usually every 60 seconds, until you can no longer pedal. Typically this test will be performed on a smart trainer, using erg mode. Many platforms such as Zwift and TrainerRoad have pre-built ramp protocols.
Analysis
Your maximal aerobic power (MAP – a marker of VO2 max) is calculated as the maximum power you achieve in the ramp test, corrected for the amount of time you manage to complete in the final stage.
For example, if power has been increasing 25W each stage, and you make it halfway through the 350W stage, then your maximal aerobic power would be 325W (last completed stage) plus 50% of 25W (correction for uncompleted stage). This works out as 337.5W. The ramp protocol chosen (step length and power increments) will impact MAP, so you should only compare results across tests with the same protocol.
FTP is then usually calculated as 75% of your MAP; a concept attributable to cycling coach Ric Stern who originally proposed a range of 72-77%. Platforms such as TrainerRoad and Zwift automatically estimate FTP for you, so you don’t need to do these calculations.
How our athletes scored:
Jane:
MAP: 313W
Estimated FTP: 235W (4.5W/kg)
Sarah:
MAP: 353W
Estimated FTP: 265W (4.9W/kg)
Power profile testing
This style of testing involves completing maximal efforts over a variety of durations, measuring how power progressively drops off over longer durations. The major benefit of this testing approach is that it reveals relative strengths and limiters and allows riders to assess how these abilities are changing over time.
You’ll also gain information on how to individualise training intensity targets. Training zones based on FTP are derived from population averages, which do not work well for everyone, so this individualisation of training zones can help improve the quality of your training and also help avoid burn-out from riding too hard.
How to home test with lab-like precision
To get the most from any testing, follow these four simple guidelines:
1. Test under the same conditions each time, so that your results aren’t skewed by external factors such as fatigue. Ideally you should be rested, well-fuelled with carbohydrates and hydrated.
2. Use a consistent protocol each time you test. Don’t switch between different tests, as your results won’t be comparable.
3. If testing on the road, try to find a location that’s quiet and free from junctions or other hazards that might be dangerous or cause you to slow down.
4. Most people find it easiest to produce power on a moderate gradient.
5. Re-test your fitness roughly every eight to 12 weeks.
Though Jane and Sarah’s data is fairly similar over 20 minutes and five minutes, there are marked differences over one-minute and five-second durations, showing that Sarah is stronger over these shorter efforts. Knowing this helps us design more effective training programmes. For example, with Jane, we focused on building her anaerobic capacity and neuromuscular power. For Sarah, the emphasis was on her VO2 max and threshold power, which we felt was the main limiter hindering further progress.
The power profile data also provides an indication of how we might want to adapt training intensities above threshold to suit these different athletes, e.g. six times 60sec on/3min off). For Jane, with her lower anaerobic capacity, we might initially set her a target of 125-135% FTP. In contrast, for Sarah, we might expect these efforts to be performed somewhere closer to 140-150% FTP.
A key drawback of power profile testing is its complexity. There are a variety of different testing and analysis approaches available, and it can be hard to choose between them. Interpretation of the results is likewise more complex, and may require input from a coach.
Physically and mentally, this testing may be more daunting than the previous two testing methods, especially if you’re following a protocol such as Wahoo Systm’s 4DP test, where all efforts are performed in the same session. Finally, while it’s possible to do some basic power profile testing for free by comparing your results with a power profile chart, many of the analysis options have an associated cost (e.g. to purchase or subscribe to software, or pay a fee per test).
Overall, power profile testing is an approach we’d recommend for anyone serious about optimising their training and performance. It provides much more comprehensive data about your abilities and how your training should be designed.
Why do it?
Estimate FTP
Understand strengths and limiters, and evaluate changes in these over time
Understand how to adapt training intensity targets
The protocol
This style of testing involves completing maximal efforts over several (typically three or four) durations.
There are a range of different protocols and analysis methods that can be used. Common test durations are five seconds, one minute, five minutes and 20 minutes to test, respectively, neuromuscular power, anaerobic capacity, VO2 max and threshold power. Some platforms (e.g. Wahoo Systm) will walk you through a power profile test step by step. Efforts longer than one minute should be performed in separate sessions, so that accumulating fatigue does not skew the results. Efforts should be consistently paced across the duration, and ideally should be preceded by a good warm-up.
Analysis
At its most basic, this involves comparing your maximal power (in W/kg) over five seconds, one minute, five minutes and 20 minutes to a power profile chart, to identify the domains (e.g. neuromuscular power vs VO2 max) in which you are relatively stronger and weaker.
Alternatively, there are various platforms/applications that produce a strengths and limiters report. The most popular include Systm’s 4DP, WKO5 and INSCYD. All will estimate FTP and generate individualised training intensity targets. The latter two also model physiological parameters, such as VO2 max and anaerobic capacity – simulating the results you’d get from a lab test.
How our athletes scored
Jane:
5sec: 586W (11.3W/kg)
1min: 372W (7.2W/kg)
5min: 296W (5.7W/kg)
20min: 252W (4.8W/kg)
Sarah:
5sec: 725W (13.4W/kg)
1min: 519W (9.6W/kg)
5min: 306W (5.7W/kg)
20min: 270W (5.0W/kg)
Taking a balanced perspective
Power-based testing is a convenient approach to fitness testing that can really enhance your training. However, it’s important to acknowledge that all power-based tests are sensitive to variables including motivation and fatigue. Also, producing a truly maximal effort outside of competition is very hard.
Power-free fitness tests
If you don’t have a power meter or smart-trainer, try these simple ways to benchmark your progress
Local circuit
Pick a local loop that takes you 30-60min and isn’t too littered with junctions and heavy traffic. Ride it as hard as you can, noting your time or, even better, creating a Strava segment. Repeat monthly.
Hill climb
Cycle gently to your nearest long climb, ideally at least 5min, and ride up it as hard as you can. Record your time and note it down ready to compare next time.
Sprint test
From a rolling start in the biggest gear possible, hit the lap button and sprint to your maximum speed. When you get home, check the speed and how long it took to get there. That’s your benchmark.
In addition, power-based tests don’t capture all aspects of fitness (even the full power profile test). It’s common for athletes to feel subjectively that their cycling performance has improved, but not to see this reflected in test results. Some cyclists simply don’t test well!
We can see this in Jane and Sarah’s data. Across the board, Sarah seems to score better in all tests. However, we know that Jane can average a higher power output over an hour (4.4W/kg versus 4.3W/kg). We strongly suspect that Jane has better endurance, and the difference in power and performance between the two riders would become more marked over even longer durations.
Ultimately, it’s important not to attach too much importance to the results of performance testing, and to interpret your results in the context of your subjective feelings and your recent training. If you’ve been working on developing your sprint abilities, for example, then you shouldn’t necessarily expect to see an increase in your FTP. Power testing provides a useful insight to help guide training, but don’t use this as your sole measure of progress.

Thank you for reading 20 articles this month* Join now for unlimited access
Enjoy your first month for just £1 / $1 / €1
*Read 5 free articles per month without a subscription

Join now for unlimited access
Try first month for just £1 / $1 / €1
Tom Bell is reigning British hill-climb champion and coach at High North Performance.
-
 Why do I feel like a cheat every time I ride my e-bike?
I love my e-bike but struggle with the shame that accompanies me on my rides. Why?
By Simon Fellows
-
 WTB Vulpine S TCS Gravel Tyre review - turbo charge your gravel racing (in the right conditions)
The WTB Vulpine S TCS Gravel Tyre is unashamedly aimed at riders who value speed above all else; mudpluggers need not apply
By Tim Russon
-
 What is the biking equivalent of a 'couch to 5k' running challenge?
Why it could be easier to train for a longer cycling event than a 30-minute run
By Caroline Dezendorf
-
 Does gym work really benefit your cycling fitness? Here’s how to mix up your training and reap the gains
No time for long winter miles outdoors but can’t face yet another turbo session either? Despair not! Coach Landry Bobo has an alternative winter plan to answer your prayers
By Landry Bobo
-
 Rollers vs indoor bike trainers: which is best for you?
Indoor bike trainers might get the most attention – but don't underestimate a humble set of rollers, here's why...
By Michelle Arthurs-Brennan
-
 Best indoor training apps for cycling: virtual riding platforms and training analysis apps
Whether it’s virtual racing and riding or training tracking, planning and analysis, there are plenty of options to choose from - here’s our top picks
By Tom Epton
-
 'I was able to pick and choose from two cycling cultures, French and English': Simon Carr on what formed him as a cyclist
The dual-nationality rider on blending the best bits from two nations' cycling cultures
By David Bradford
-
 'I've always been able to empty myself to the point of throwing up': Jack Carlin on what makes a great sprinter
The GB sprint ace talks us through what it takes to go very, very fast over the shorter distances on the track
By David Bradford
-
 How many watts does it take to beat a pro cyclist?
What’s your dream threshold? Four, five, maybe even six watts per kilo… At what point does the target number become impossible except for pros? Joe Laverick finds out
By Joe Laverick
-
 Can you train through the pain to get even fitter?
It’s a universal truth in cycling: when the hard effort hurts too much, we back off and slow down. But can we train our ability to tolerate pain? Steve Shrubsall finds out
By Stephen Shrubsall