How to skew aero claims, by an aerodynamicist
Products (like articles) need a snappy headline - but marketing claims do need to stand up to scrutiny

‘It does what it says on the tin’ worked for Ronseal, but if you’re not selling wood stain, a little extra creativity goes a long way. ‘Rotates to aid forward propulsion’ won’t sell many wheels, and ‘forms hanger for components’ isn’t a strapline likely to see frames marching out the door.
Marketing is essential if a brand intends to differentiate itself from its competitors, but where there’s a claim there should always be substantial evidence to support it.
“I can totally see why technical teams and marketing teams have arguments, ‘this wheel is probably as fast as anything else out there’ isn't going to grab headlines,” says the refreshingly honest Dov Tate.
Tate, an Oxford University engineering graduate, is the founder of UK wheel brand Parcours. He’s operating in a market I would quite confidently call saturated, but from the outset, he’s only ever made claims supported by a research document.
“I’ve always set out to be transparent. If you’re going to make aerodynamic claims, you have to show your workings. You can never test all of the variables - you can never answer every question, all you can do is put your best foot forward, justify why you’ve tested how you’ve tested, and be explicitly clear on how you’ve tested.”
Providing background means that a committed consumer can at least “dig around under the bonnet” as Tate puts it, and try to ascertain the validity of claims. But, what should they be looking for?
Dodgy yaw angles
Tests run in the wind tunnel or via Computational Fluid Dynamics (CFD) will utilise yaw angles. A yaw angle is determined by the sum of a rider’s forward velocity and wind velocity.
A 0 degree yaw angle is the point at which there is no crosswind, it is purely an effective headwind facing the rider. At the other end of the scale, 20 degrees would be an extreme crosswind (from the right, generally, -20 degrees is a strong crosswind from the left). The performance of a product will vary at different yaw angles - notably, deep section profiles may look better at high yaw angles. However, that's not much good if an average rider spends around 0.5% of their time battling such extreme conditions.
Alongside Dr Steve Faulkner at the sports engineering department at Nottingham Trent University, Tate - who attended Oxford as part of a scholarship scheme with a subsidiary of BAE (formerly British Aerospace) - has completed some hefty work analysing the correct yaw angle to study for UK riding, using sailing technology.
Tate and Faulkner believe this research is necessary because they don't think the published averages are, well, any good in the context of cycling.
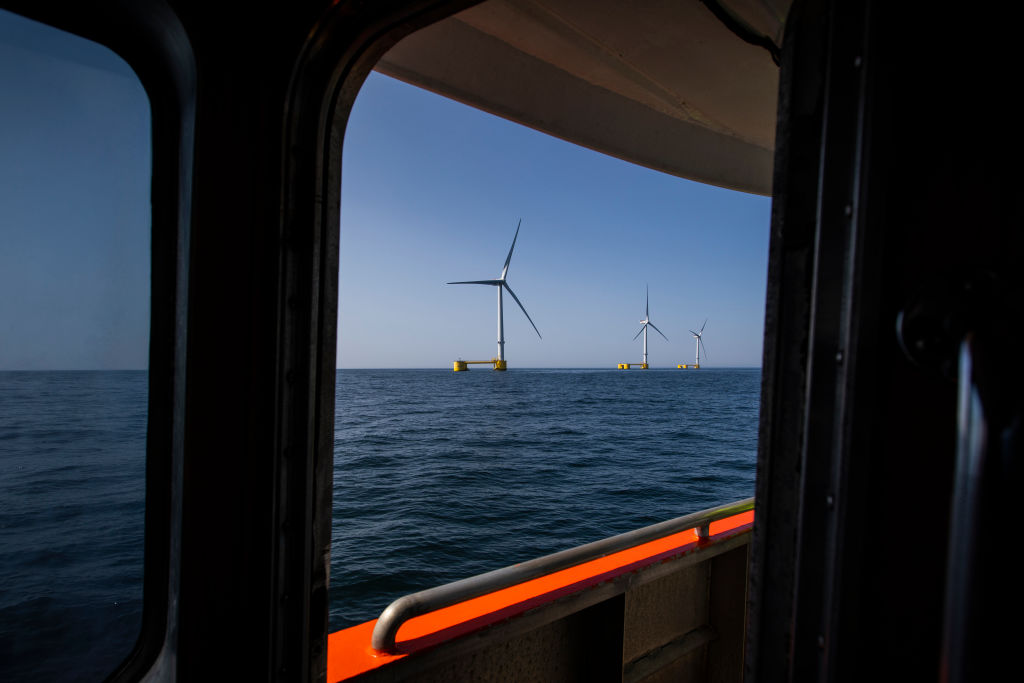
A lot of average yaw angle data comes from the energy industry
“The money behind wind data in this country is the energy industry. The average wind data that is - very helpfully - published, is skewed towards the energy industry, which is all to do with where the windiest places are, where wind generation is. You don’t build a wind turbine where it's not windy, and no wind turbine is riding along an inch or two off the ground. This is why the wind data looks so odd,” he says.
Studying a dubious average is one thing, but cherry-picking averages that make a bike look better is quite another.
“'Our bike is faster than the competition, at these particular yaw angles' - that’s fine if you can justify why you chose those yaw angles,” Tate says. Unspoken but implied is the fact that if the chosen yaw angles don't seem to make a lot of sense then questions arise as to why they were chosen. "Higher yaw angles favour deeper profiles, so they'll make those profiles look better," Tate adds.
The debate over the 'correct' yaw angles to study rages, but you can see the frequency of yaw angles Tate and Faulkner found based on 25,000 data points in the research here.
Another option open to brands is publishing data only at specific yaw angles, “one brand used to publish all of their time savings, just at 10 degrees of yaw, and sure, a deeper wheel that’s faster at 10 degrees of yaw will likely be faster at 5 degrees, but you’re magnifying the differences,” Tate says.
Choosing an unfair comparison
This one isn’t rocket science.
“Benchmarking against the wrong thing is really easy to do, bike manufacturers will choose a round tubed frame, tyre manufacturers will choose their own previous generation. Wheel manufacturers are notorious for this - how many times have you seen a time saving vs a 32 spoke Mavic Open Pro? No bike that you buy comes with a 32 spoke Mavic Open Pro anymore,” says Tate.
The same applies outside of aerodynamics, “there was a tyre released a few years ago, the claim was ‘10 watts faster’. But you go into the technical jargon and realise it’s 10 watts vs their previous generation of tyre, check that on BicycleRollingResistance.com and it transpires that tyre was 10-15 watts slower than the fastest tyres. So, they’ve now launched a tyre that’s as fast as everything else that’s out there,” Tate notes.
The effect of the facility
It’s at this point during our chat that I realise that deciphering the absolute performance of most equipment is going to be very hard for the vast majority of the population.
“You can run the same protocol in different facilities and get different answers,” Tate reveals.
Oh.
“All of our wind tunnel tests have been at A2 in North Carolina… but Silverstone is now local to us. I could go and run a test at Silverstone tomorrow, but in isolation, it’s useless because I’ve got nothing to compare it to. Short of running every test I've ever done at Silverstone, actually, from a cost perspective it probably makes sense to jump on a plane to North Carolina again.”
Why would the results differ? “It’ll be down to all sorts of things, on a macro scale, it might be influenced by the boundary conditions,” - in less scientific terms, the shape of the wind tunnel chamber, the texture of the walls/edges, the position of the rider and where the imitation wind comes from, will affect the results.
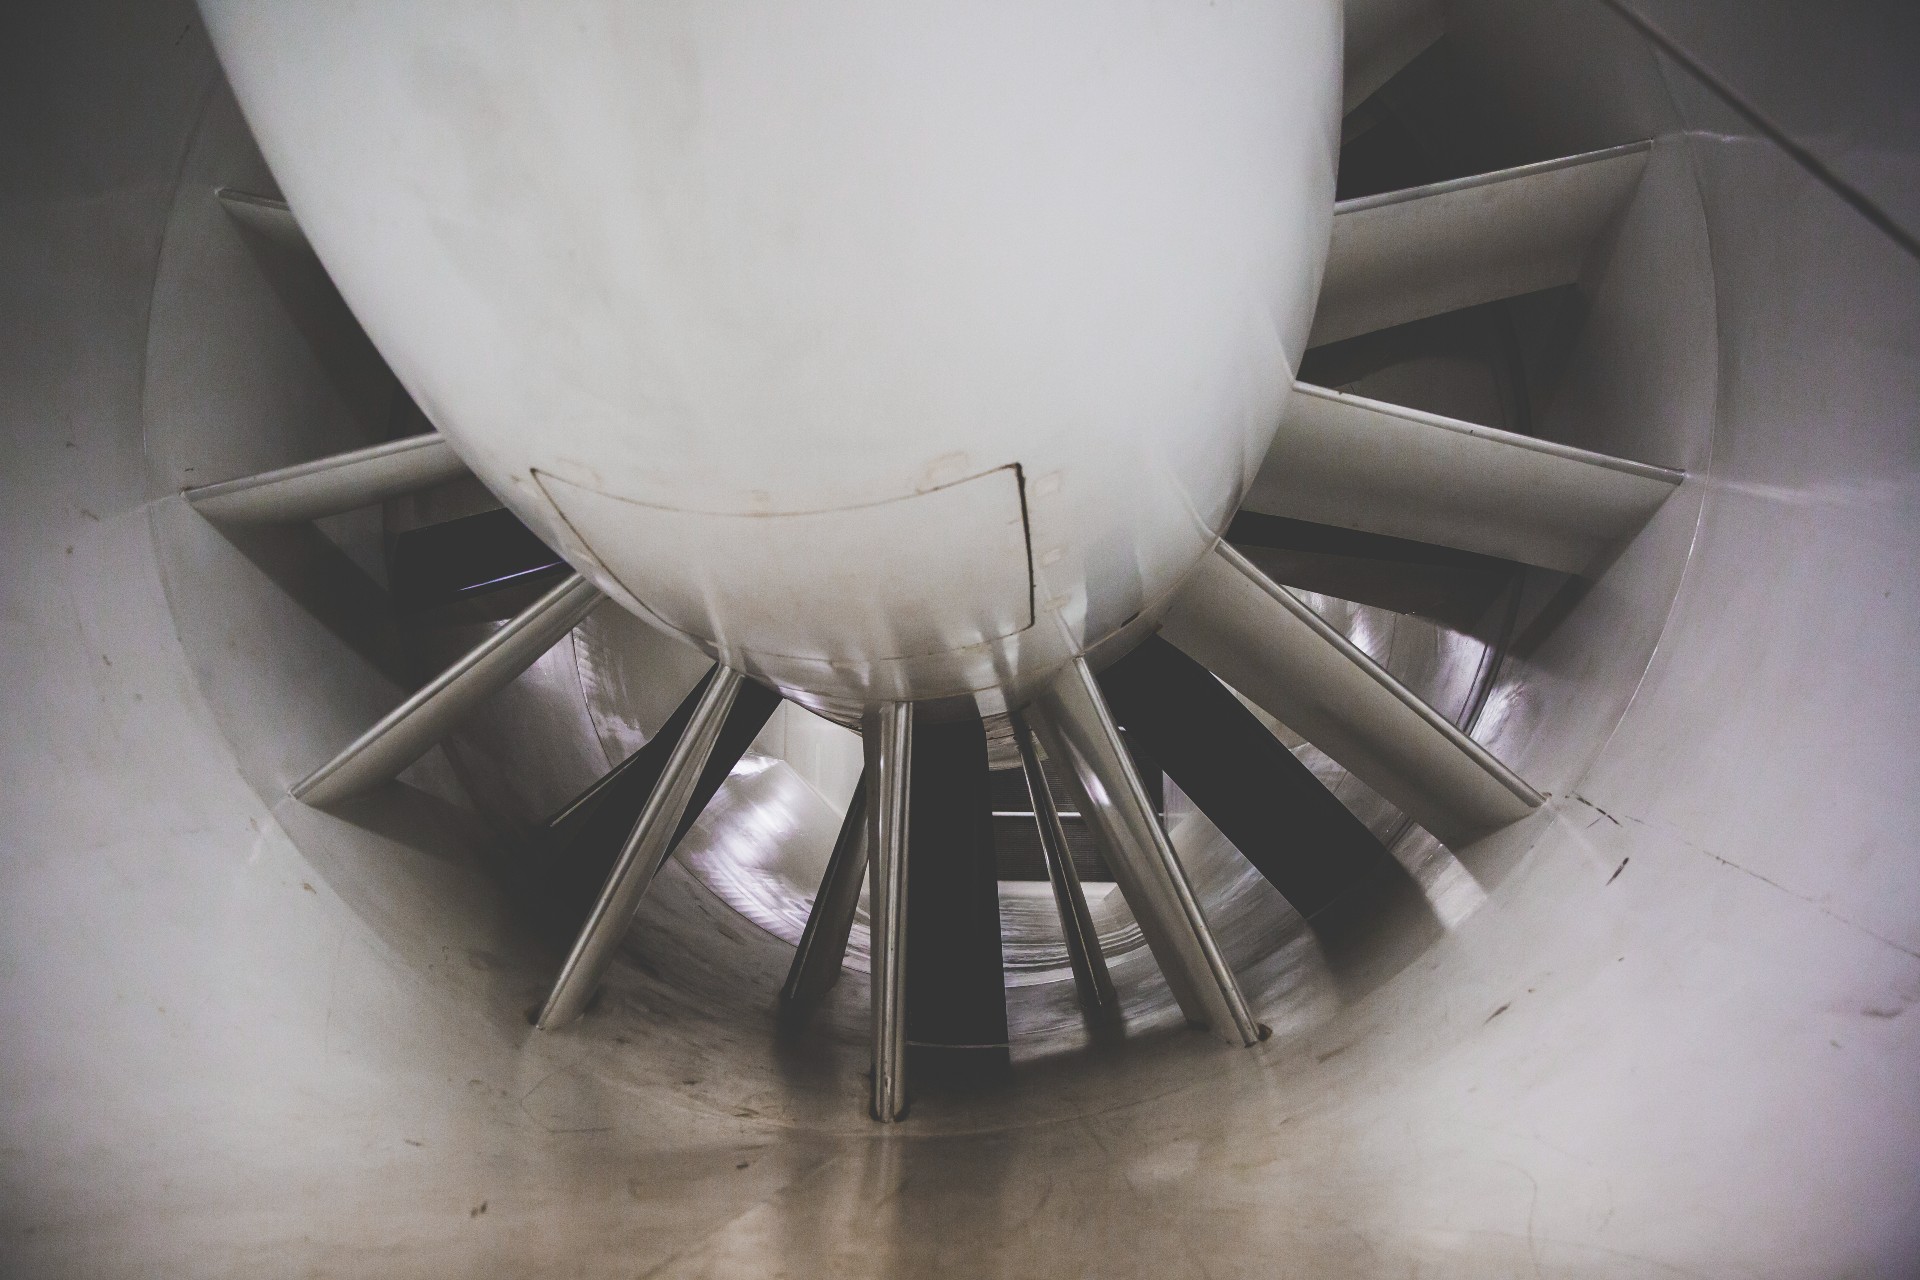
The facility used will impact results
“You’ve also got the actual unit that the test subject sits on - whether it has a blunt edge, a more profiled edge, what the rollers look like - then in terms of instrumentation, how many sensors you have, are you taking an average of many, or just using a single sensor?”
Then, there’s data protocol. “A bike in the wind tunnel is held up by stanchions, front and rear. You can leave them in [the data], but that means you are effectively penalising your overall drag. Some facilities remove the drag from the stanchions - a bit like when you bake a cake and put a bowl on a scale and hit zero, so you’re not weighing the bowl. But in this case the weight of the bowl changes during the test.
“Head-on, the stanchion has drag, but as soon as you apply a yaw angle, the downwind stanchion is going to be hidden by whatever is being tested, by taking a blunt amount off, you’re effectively over-egging the difference of the stanchion.”
Bad news for the at-home armchair aerodynamicist: without having an encyclopedic knowledge of each wind tunnel’s protocol, we risk comparing apples with oranges, and ultimately, coming out with something pear-shaped.
Unit blufferey
Aero data is nearly always published based on a 50kph/30mph speed, but it’s misleading for brands not to be clear about the velocity.
“Anything that is purely related to drag, eg, in drag saving grams, or power saving in watts, will also be related to velocity. If there’s ever a claim of ‘you will save x watts’, it should always be followed with ‘at x velocity’.”
Testing almost always takes place at 30mph/50kph
There is actually a fairly good reason behind using 30mph, Tate notes.
“Everyone uses 30mph, that’s the speed at which you run the wind tunnel test as it gives you greater resolution on the differences. In simple terms, going from 15 mph to 30 mph will magnify any aero differences in terms of watts of drag by a factor of 8, but it will only increase the error margin of the wind tunnel by a factor of 2, [so] you can pick up much smaller differences, without worrying about the accuracy of the test.”
However, he adds: “[brands] do need to contextualize it, either say ‘at this speed’, or scale it down, to a speed you’ll be riding at.”
On the plus side, when it comes to absolute time difference over a distance, slower riders should enjoy a similar, or greater, time-saving (it depends who you ask): whilst their watt savings are lower, they have longer on the course to accumulate gains.
Rider-off for resolution
Doublespeak alert
Ever get the feeling that an adjective is pretending to be more impactful than it really is?
‘Aerospace grade’ and ‘military grade’ are excellent examples.
Firstly, these phrases can mean anything from ‘formed the chassis for Apollo 13’ or ‘was used for a dinner plate on a flight from Gatwick to Mallorca'.
Secondly, as Tate notes, “just because it's on a space shuttle, doesn't mean you should have it on your bike, it may be perfect for your bike, there is no way of telling - it literally is just an interesting fact for people.”
Precision engineered is another good one. “Well, I didn’t want it wonkily engineered,” Tate notes. Fair.
Some of Tate’s statements surprised me. For instance, I expected to learn that testing minus a rider was a bit of a ruse, and that any graph without error bars should be mistrusted. The debate on both rages, but there are some good arguments to the contrary.
“In an ideal world, you want to test a full system, with a rider, pedalling. But from my own experience, we’re looking at differences like putting the tyre tread the right way round or not, the size of the rotor, very small differences, 1 watt or below. If you can find me a rider who can hold their position to within 1 watt, I would be incredibly impressed and very sceptical.
“By removing that variable, you’re able to test at a higher resolution,” says Tate. The argument that no bike, wheel or equipment rides alone still stands, but the logic for the opposing argument makes a lot of sense.
Regarding showing the margin for error - error bars - alongside a claim, in some instances, Tate says the differences might be so small that they don’t make life any easier.
“If you’re comparing an aero bike with a round tubed bike, the differences are pretty big. But once you get down into the weeds of ‘our aero bike vs competitor A’s aero bike’, frankly the differences are going to be pretty small and I would bet that the error bars wouldn’t be substantially different to the bike differences,” Tate says. So, our gains are so marginal now that the margin for error is greater.
How does any of this help the consumer?
If all of this insight leaves you feeling, well, none the wiser then you’re not alone.
To an extent, according to Tate, we’ve pretty much reached ‘peak aero’, without a major engineering change, or a UCI rule change - so, any aero bike that follows the generic shaping is probably going to be pretty fast, and any wheel from a brand that does the research, ditto.
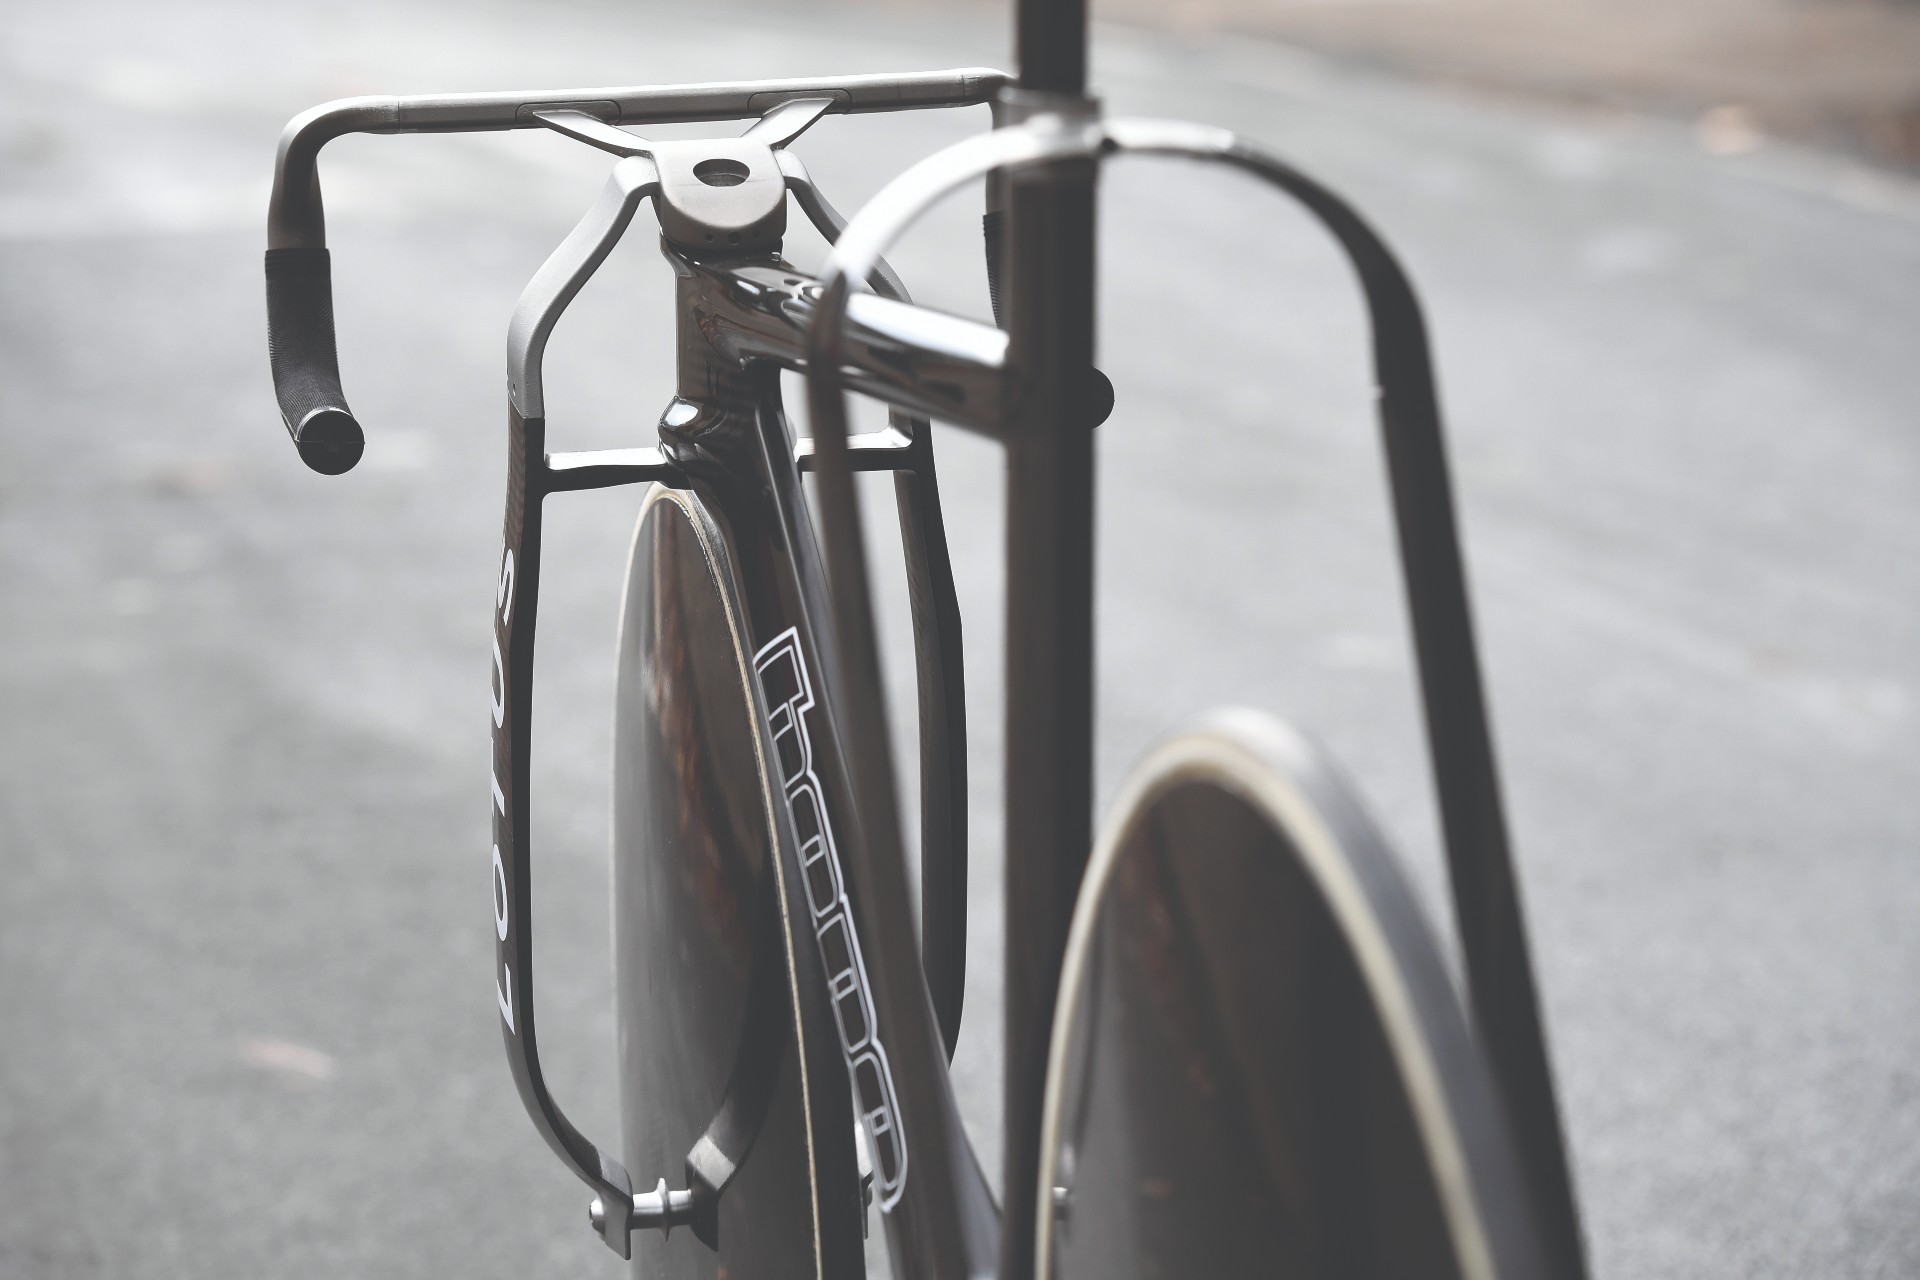
The Hope track bike deviated wildly from the norm
“You’ve just to look at the Olympics, on the track you’ve got two totally divergent design philosophies in the Australian Argon 18 and the GB Hope [x Lotus HB.T] bike. Hope, you could park a truck between the rim and the rear fork, Argon you could barely slide a piece of paper in there, yet funnily enough both bikes were pretty quick.
"And that's a polar difference. Road bikes are much more similar. We know what a fast bike looks like, there have been enough CFD simulations to tell us."
Whilst on the Olympic stage a fraction of a second is substantial (in the end, Italy won with a time of 3:42.032 to Denmark's 3:42.198), to most road riders it's not - so, with the track elite seeing relatively minute time saving for radical design adjustments, the similarity of road frames has to tell us that the deviation between them can only go so far.
The same applies within Tate's field, "we know what a fast wheel rim looks like now, we’ve all spent the money on CFD, probably all with the same people, doing the same tests, it's not a surprise anymore," he states.
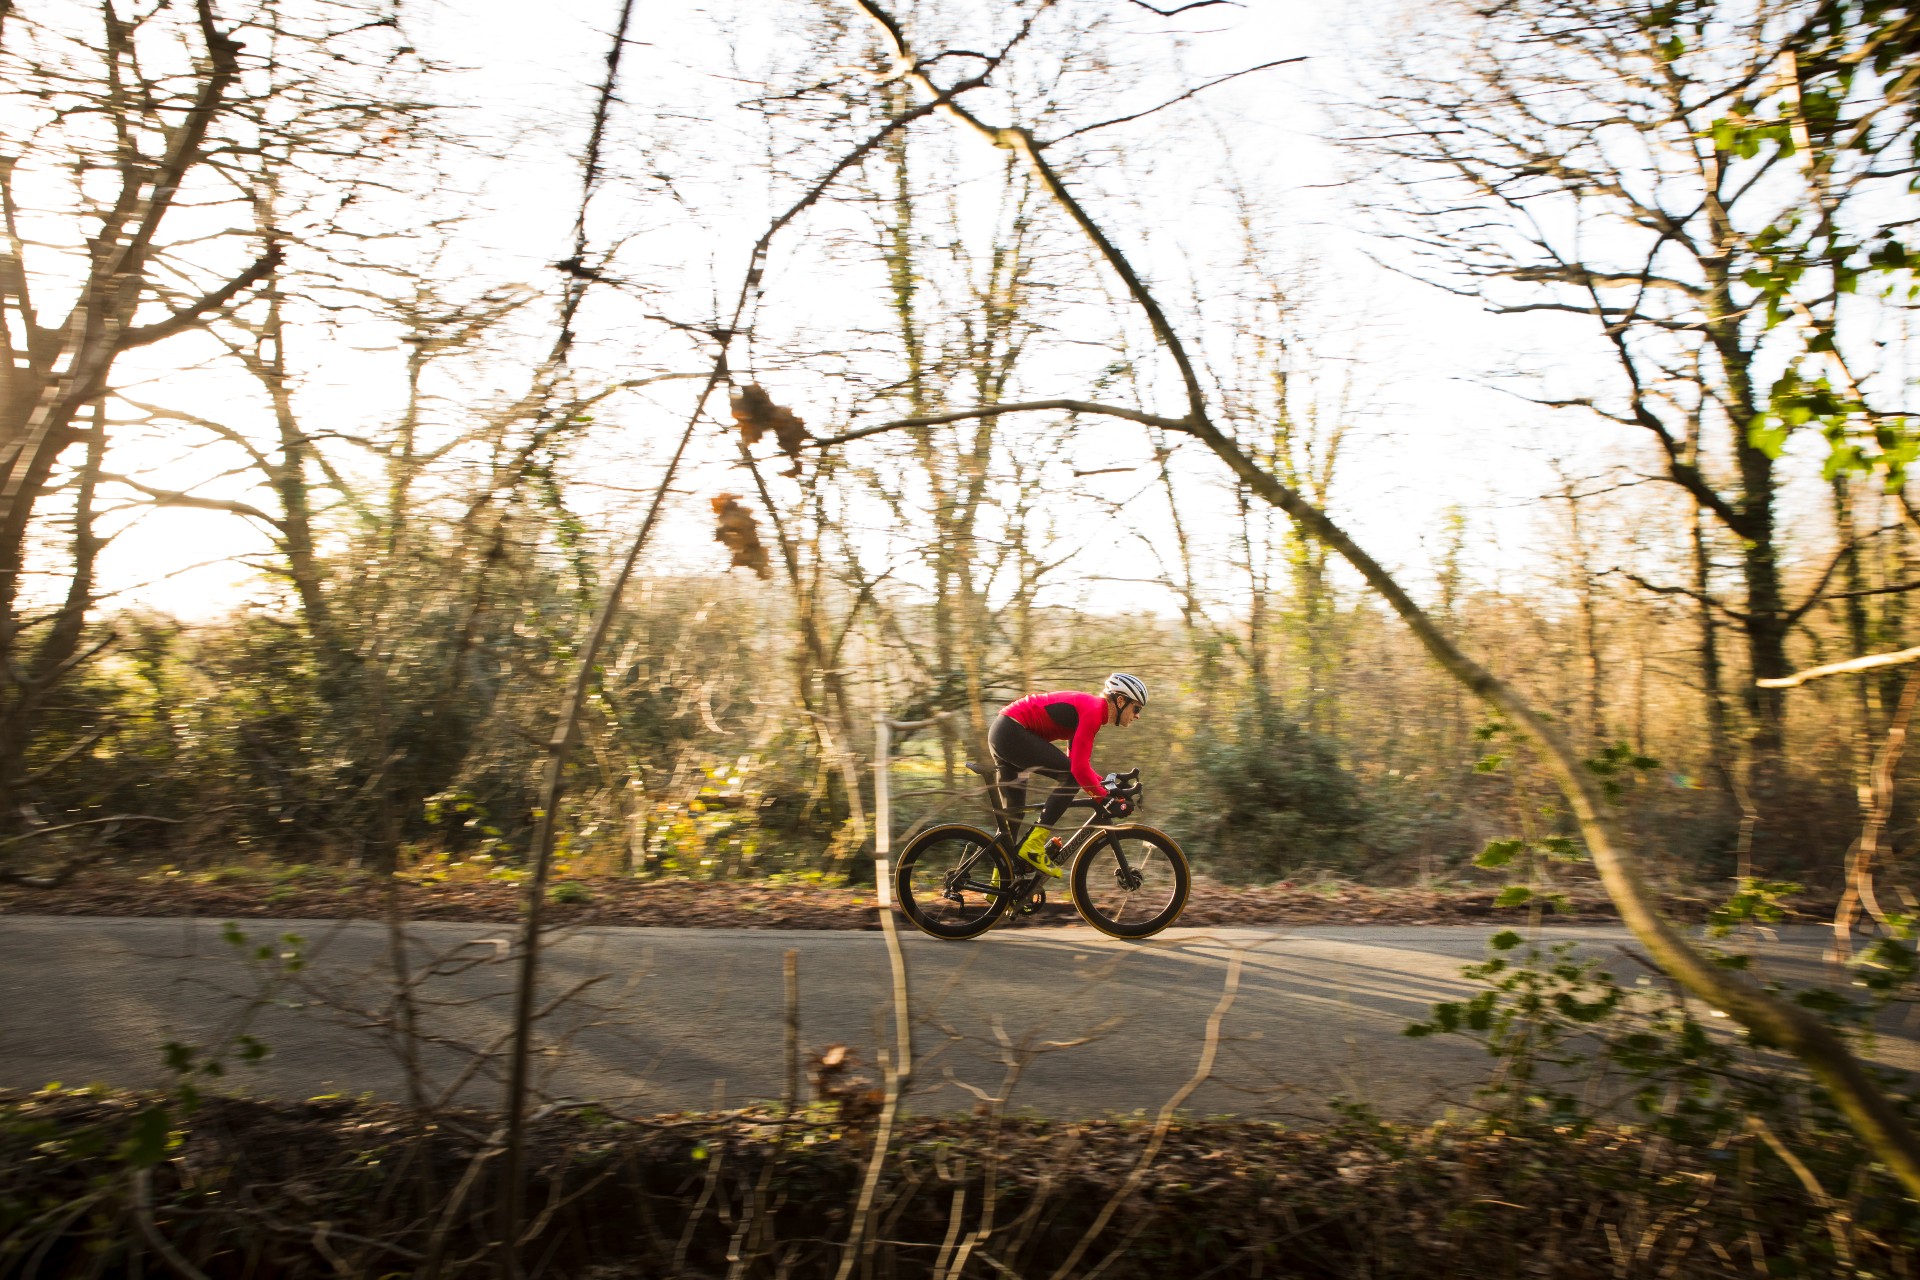
The brutal truth? Buy the bike you like. Which might not be so brutal, afterall
“I think within the current parameters, we’re quite good at making things pretty aerodynamic. That's why if I see a press release that says ‘this is the fastest by some margin’, alarm bells go, and I’m immediately looking to see how they’ve manipulated the data.”
And what does that mean for the consumer? “You can look at the numbers from a test in isolation, and say ‘yes, they’ve created a bike that is substantially more aero than a bike I’ve ridden before, so there's a good gain to be had there’,” anything more concrete is going to be difficult. The answer is perhaps unsatisfying for those who like absolutes: “ultimately, buy the bike you like because you’re never going to know which is the fastest.”

Thank you for reading 20 articles this month* Join now for unlimited access
Enjoy your first month for just £1 / $1 / €1
*Read 5 free articles per month without a subscription

Join now for unlimited access
Try first month for just £1 / $1 / €1
Get The Leadout Newsletter
The latest race content, interviews, features, reviews and expert buying guides, direct to your inbox!
Michelle Arthurs-Brennan the Editor of Cycling Weekly website. An NCTJ qualified traditional journalist by trade, Michelle began her career working for local newspapers. She's worked within the cycling industry since 2012, and joined the Cycling Weekly team in 2017, having previously been Editor at Total Women's Cycling. Prior to welcoming her first daughter in 2022, Michelle raced on the road, track, and in time trials, and still rides as much as she can - albeit a fair proportion indoors, for now.
Michelle is on maternity leave from April 2025 until spring 2026.
-
 How do the pros train? Noemi Rüegg's 26 hour training week
Winner of this year’s Tour Down Under, the EF Education-Oatly rider is a climber whose talent is taking her to the top
By Chris Marshall-Bell
-
 Save £42 on the same tyres that Mathieu Van de Poel won Paris-Roubaix on, this Easter weekend
Deals Its rare that Pirelli P-Zero Race TLR RS can be found on sale, and certainly not with a whopping 25% discount, grab a pair this weekend before they go...
By Matt Ischt-Barnard